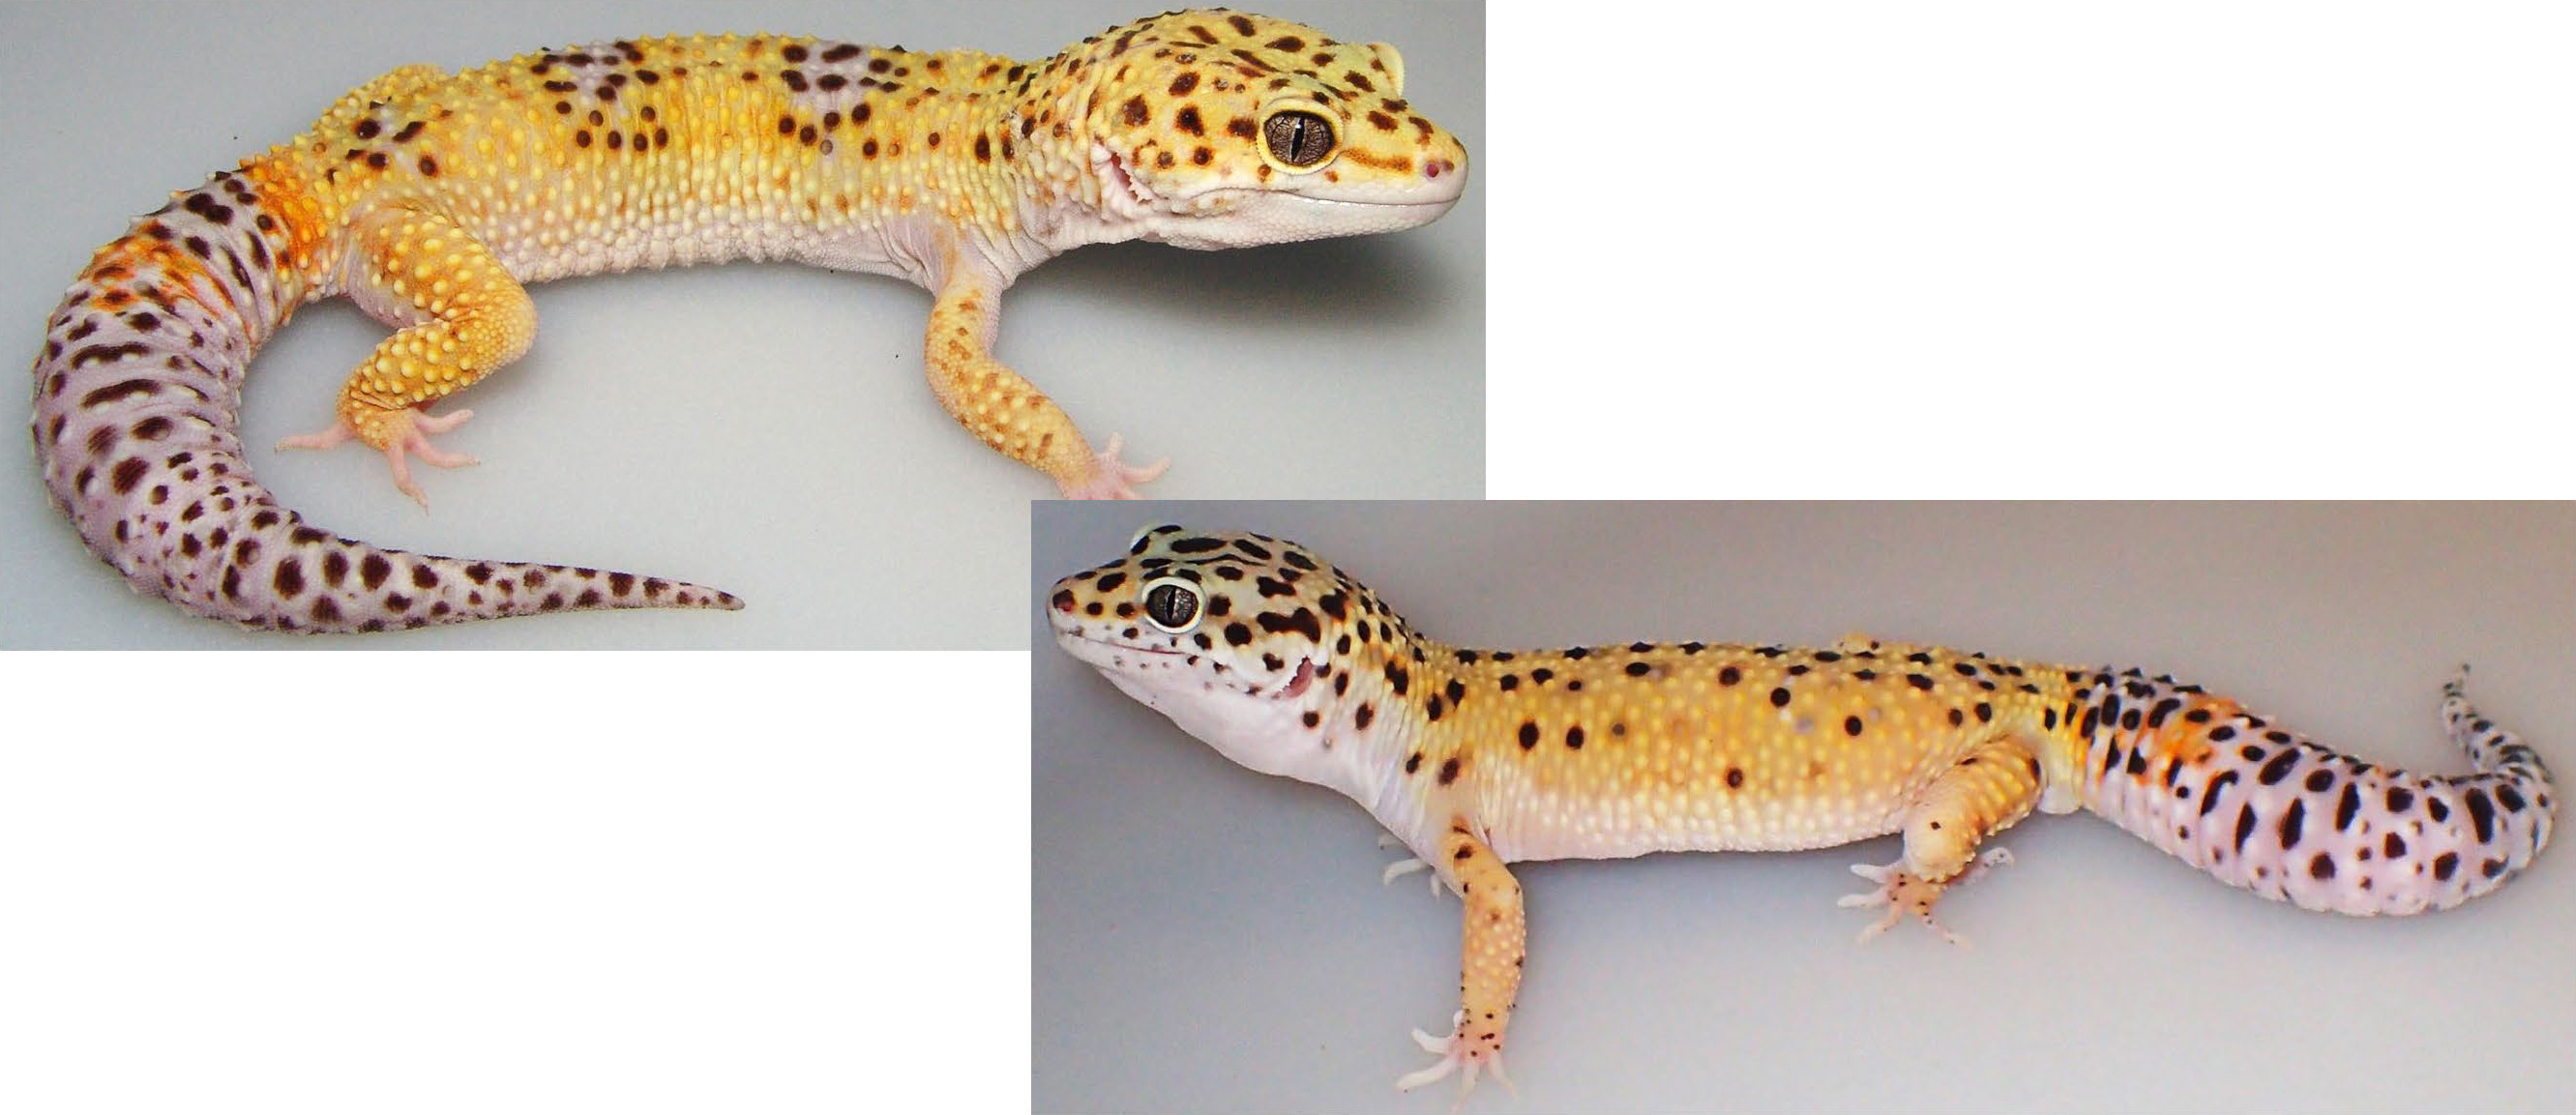
Figure 1: Example geckos with different spot patterns on their bodies. Images adapted from [3].
The variation of the pattern on the body of geckos (Figure 1) can be studied by measuring pattern statistics [1,2]. For example, we measured how much area the spots covered as a fraction of the total skin area ("Fractional Area") and the average eccentricity of the spots, which measures how round or elongated the spots are, as in Figure 2.
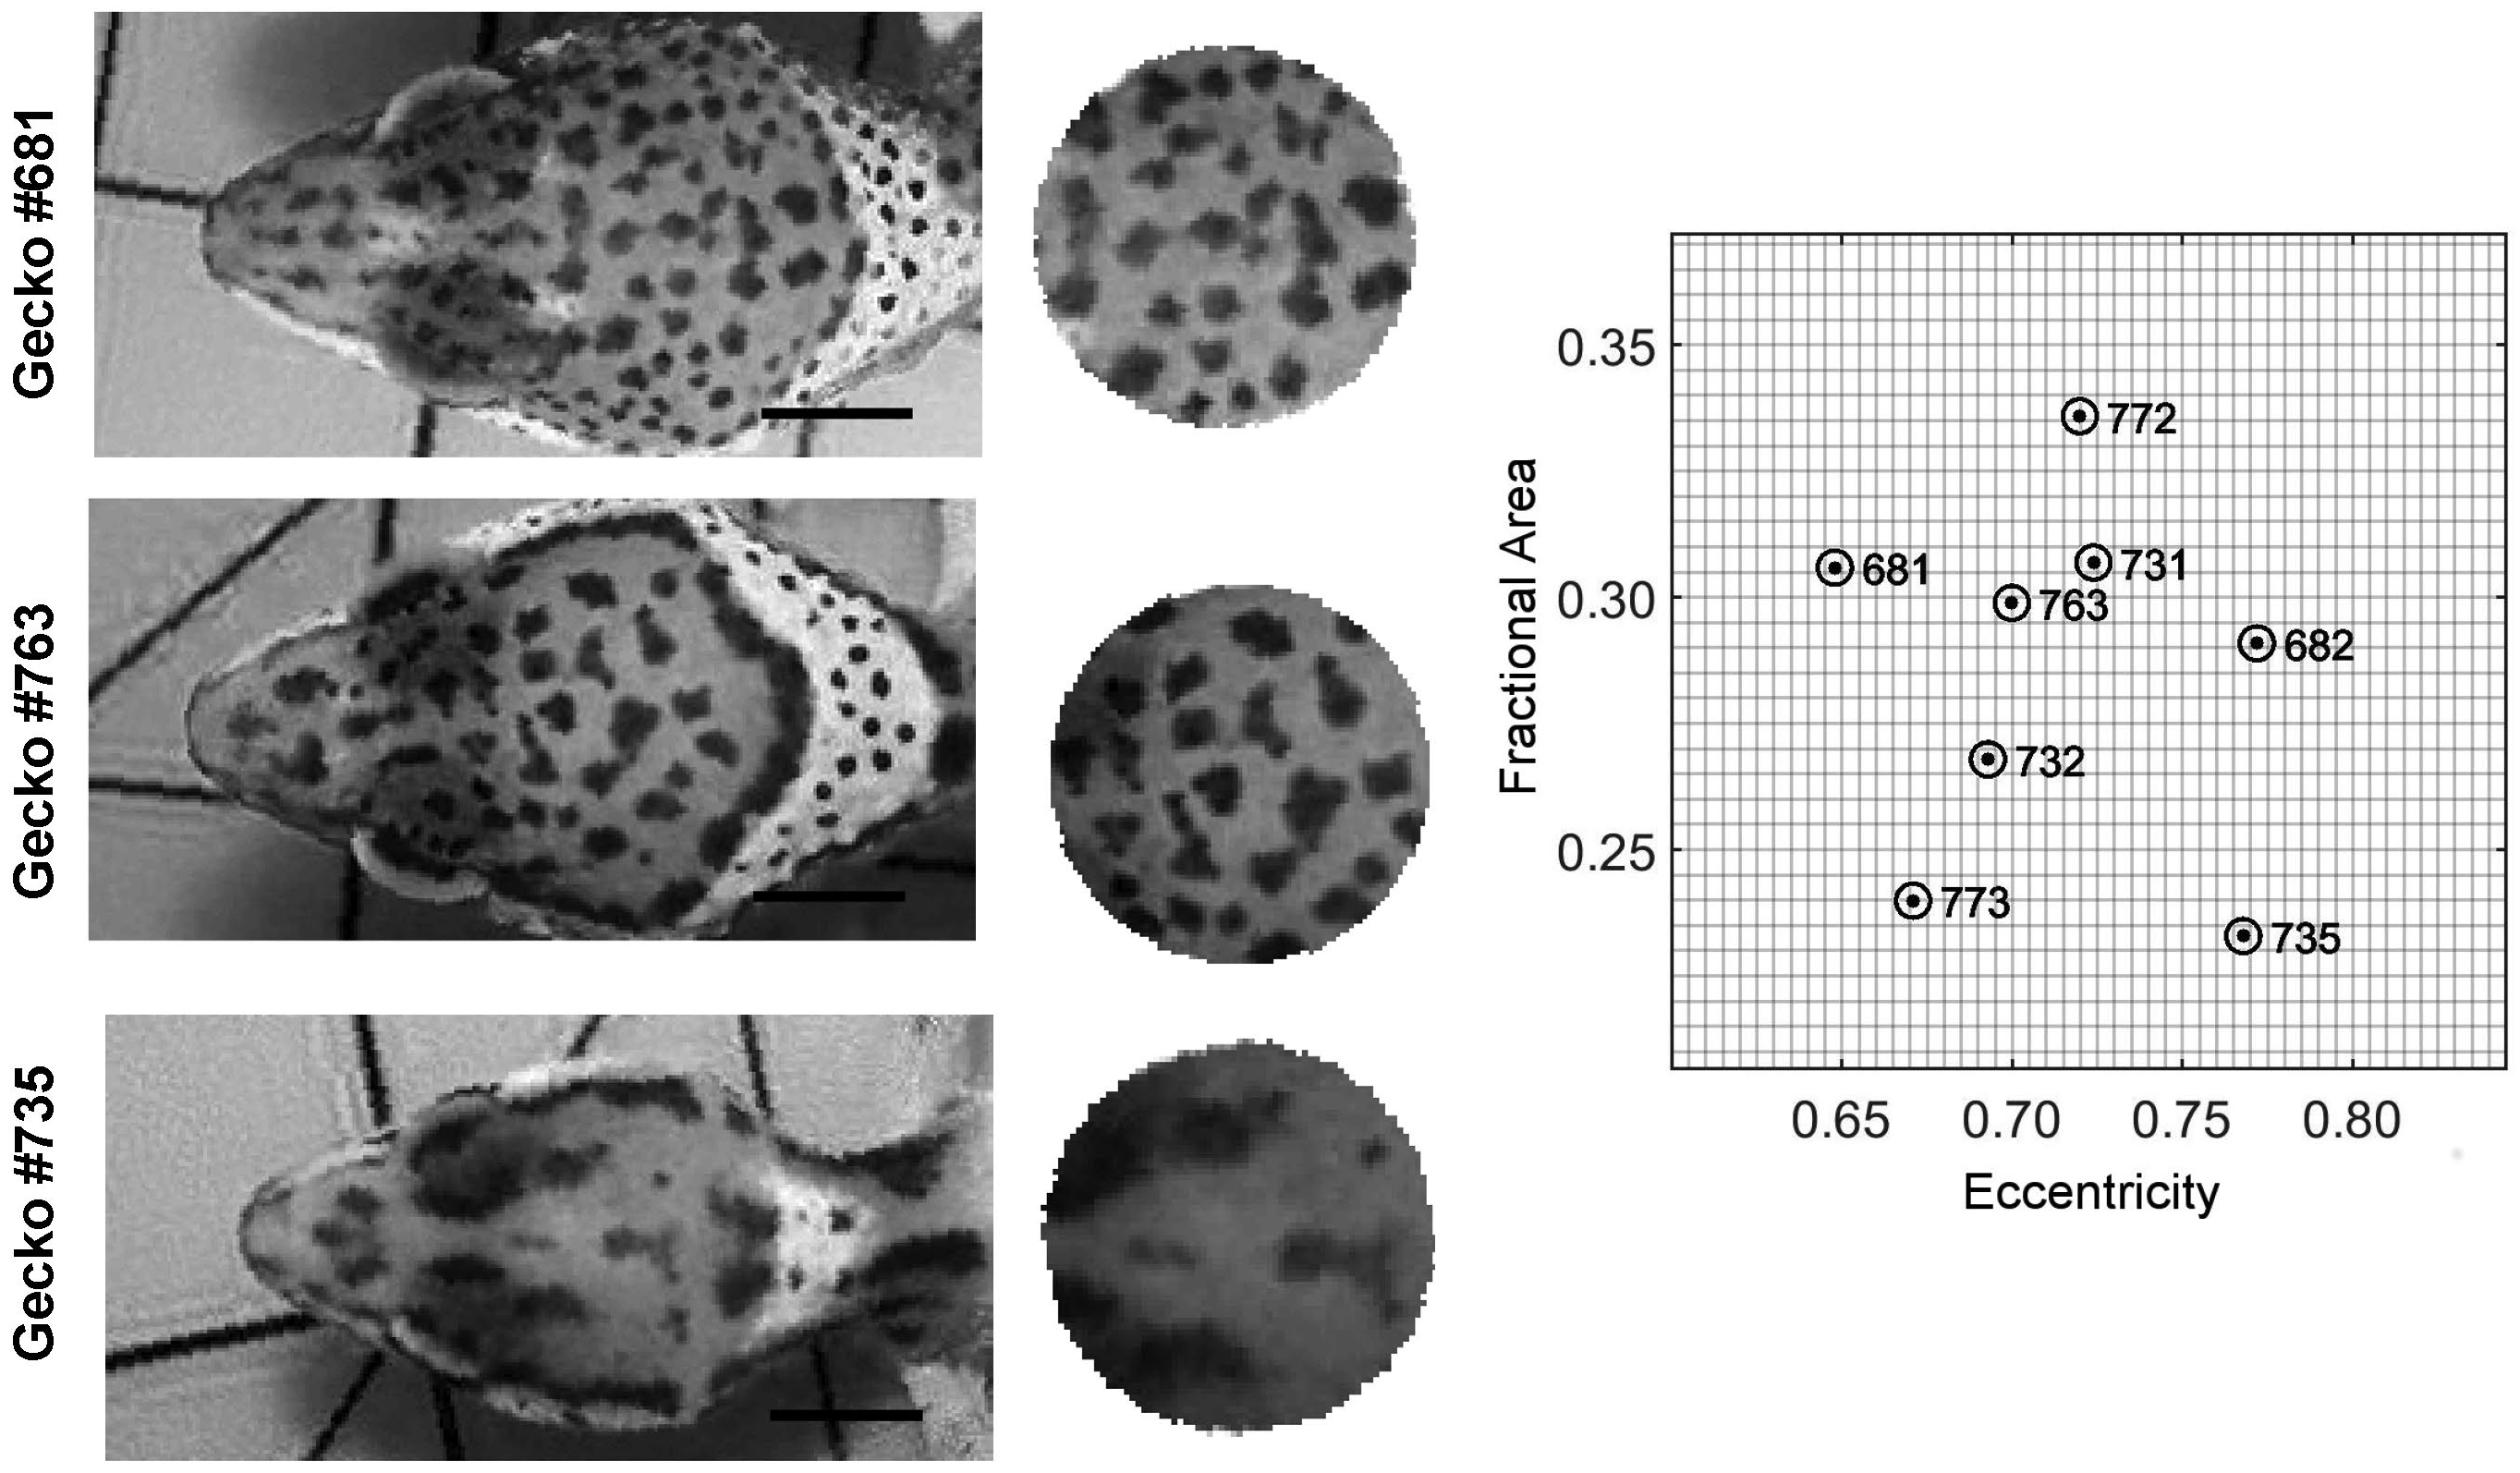
Figure 2: The patterns for individuals 681 and 763 (top and middle panel) have similar spot characteristics. The pattern spots for individual 735 (bottom panel) have a lower fractional area and higher eccentricity. Images adapted from [1] and covered by a CC-BY 4.0 license (https://creativecommons.org/licenses/by/4.0/).
We characterized patterns with 14 different indices designed to capture a variety of traits, such as characteristics of pattern shapes, distances between pattern elements, or uniformity of pattern elements. Each point in Figure 3 represents a body part of a different animal in the space of the first and second principal component (PC1 and PC2). PC1 can be identified as a measure of pattern size, and PC2 can be seen as a measure of characteristic pattern length.
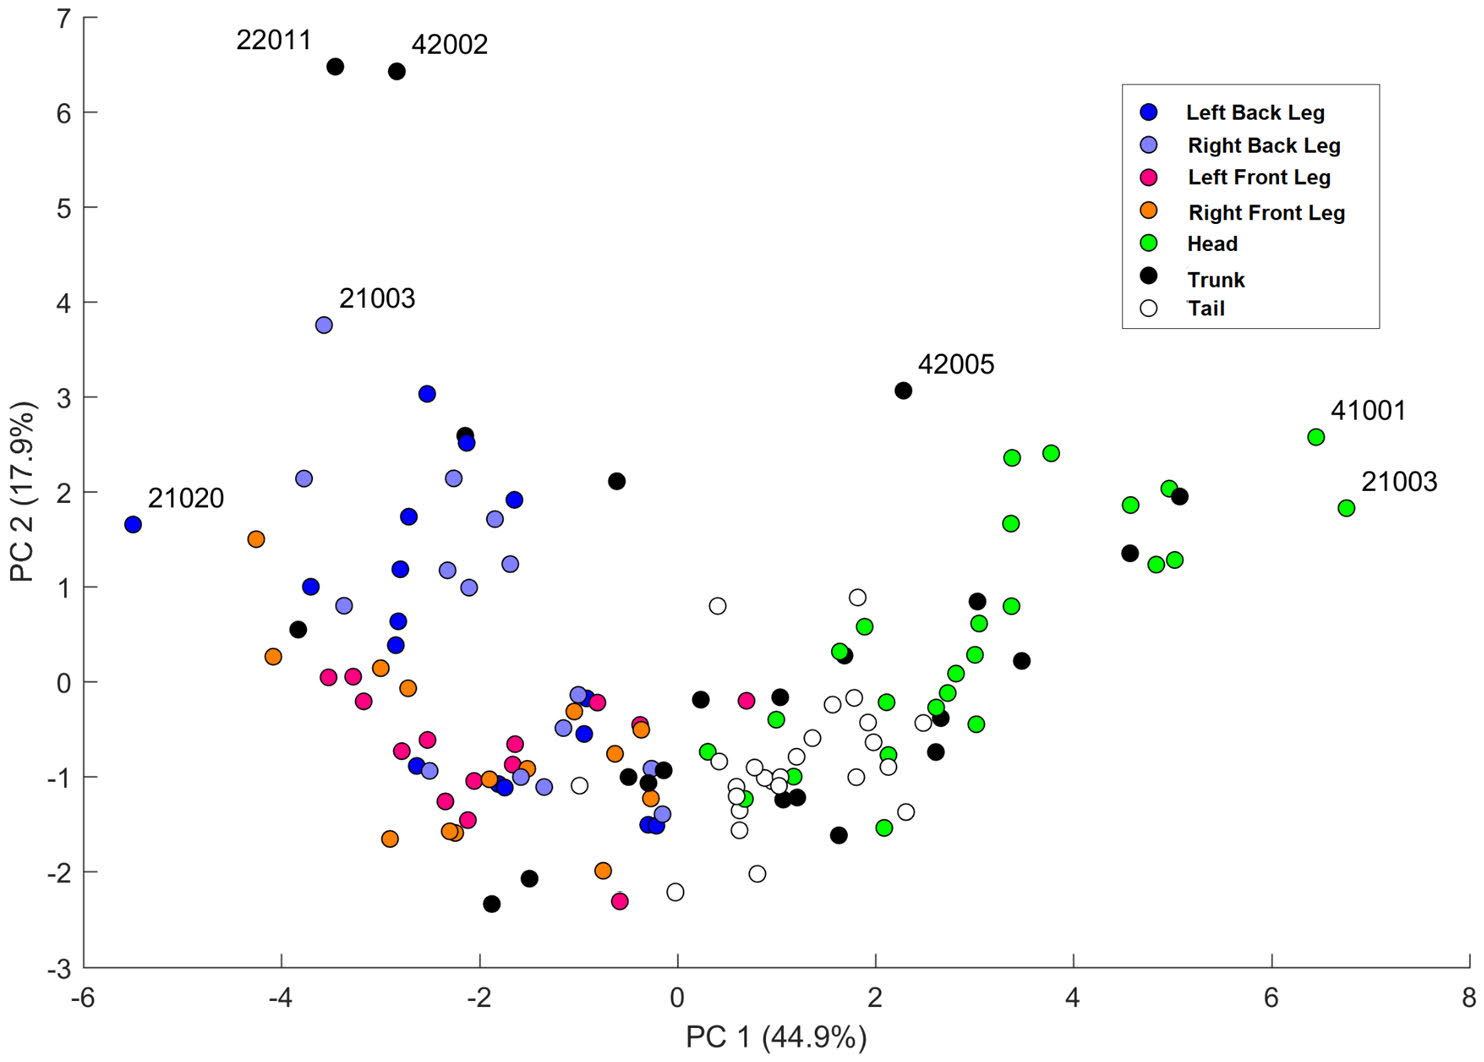
Figure 3: Each point in this plot represents the body part of a different animal, and we show the first and second principal components, which are related to pattern size and characteristic pattern length. Outliers are labeled with the IDs of the geckos. For example, gecko ID 42002 has a trunk that is sparsely patterned by small spots. Image reproduced from [2] and covered by a CC-BY 4.0 license (https://creativecommons.org/licenses/by/4.0/).
We use a reaction diffusion model to simulate the process which produces the observed skin patterning (see Movie 1). By adjusting the model parameters, we can simulate spots with the statistical properties matching any particular gecko pattern. Specifically, we adjust the amplification rate of a simulated activator molecule, the inhibition rate of a simulated inhibitor molecule, and their diffusion rates.
Movie 1: Gecko patterns and simulation (far right) [3]. See reference [1] for more information about the reaction-diffusion equations that we considered.
Including random noise in the initial conditions for the pattern-generating reaction-diffusion equations gives rise to different patterns with similar characteristics ("digital clones"). Simulations of n=1,000 patterns generate "phenotype clouds" for each observed gecko skin patterns, as we show in Figure 4.
This approach allows for quantifying the closeness of patterns. For example, as we show in Figure 4A, the skin pattern of gecko #772 is sufficiently far from that of gecko #682 that their difference cannot be due to random variation alone.
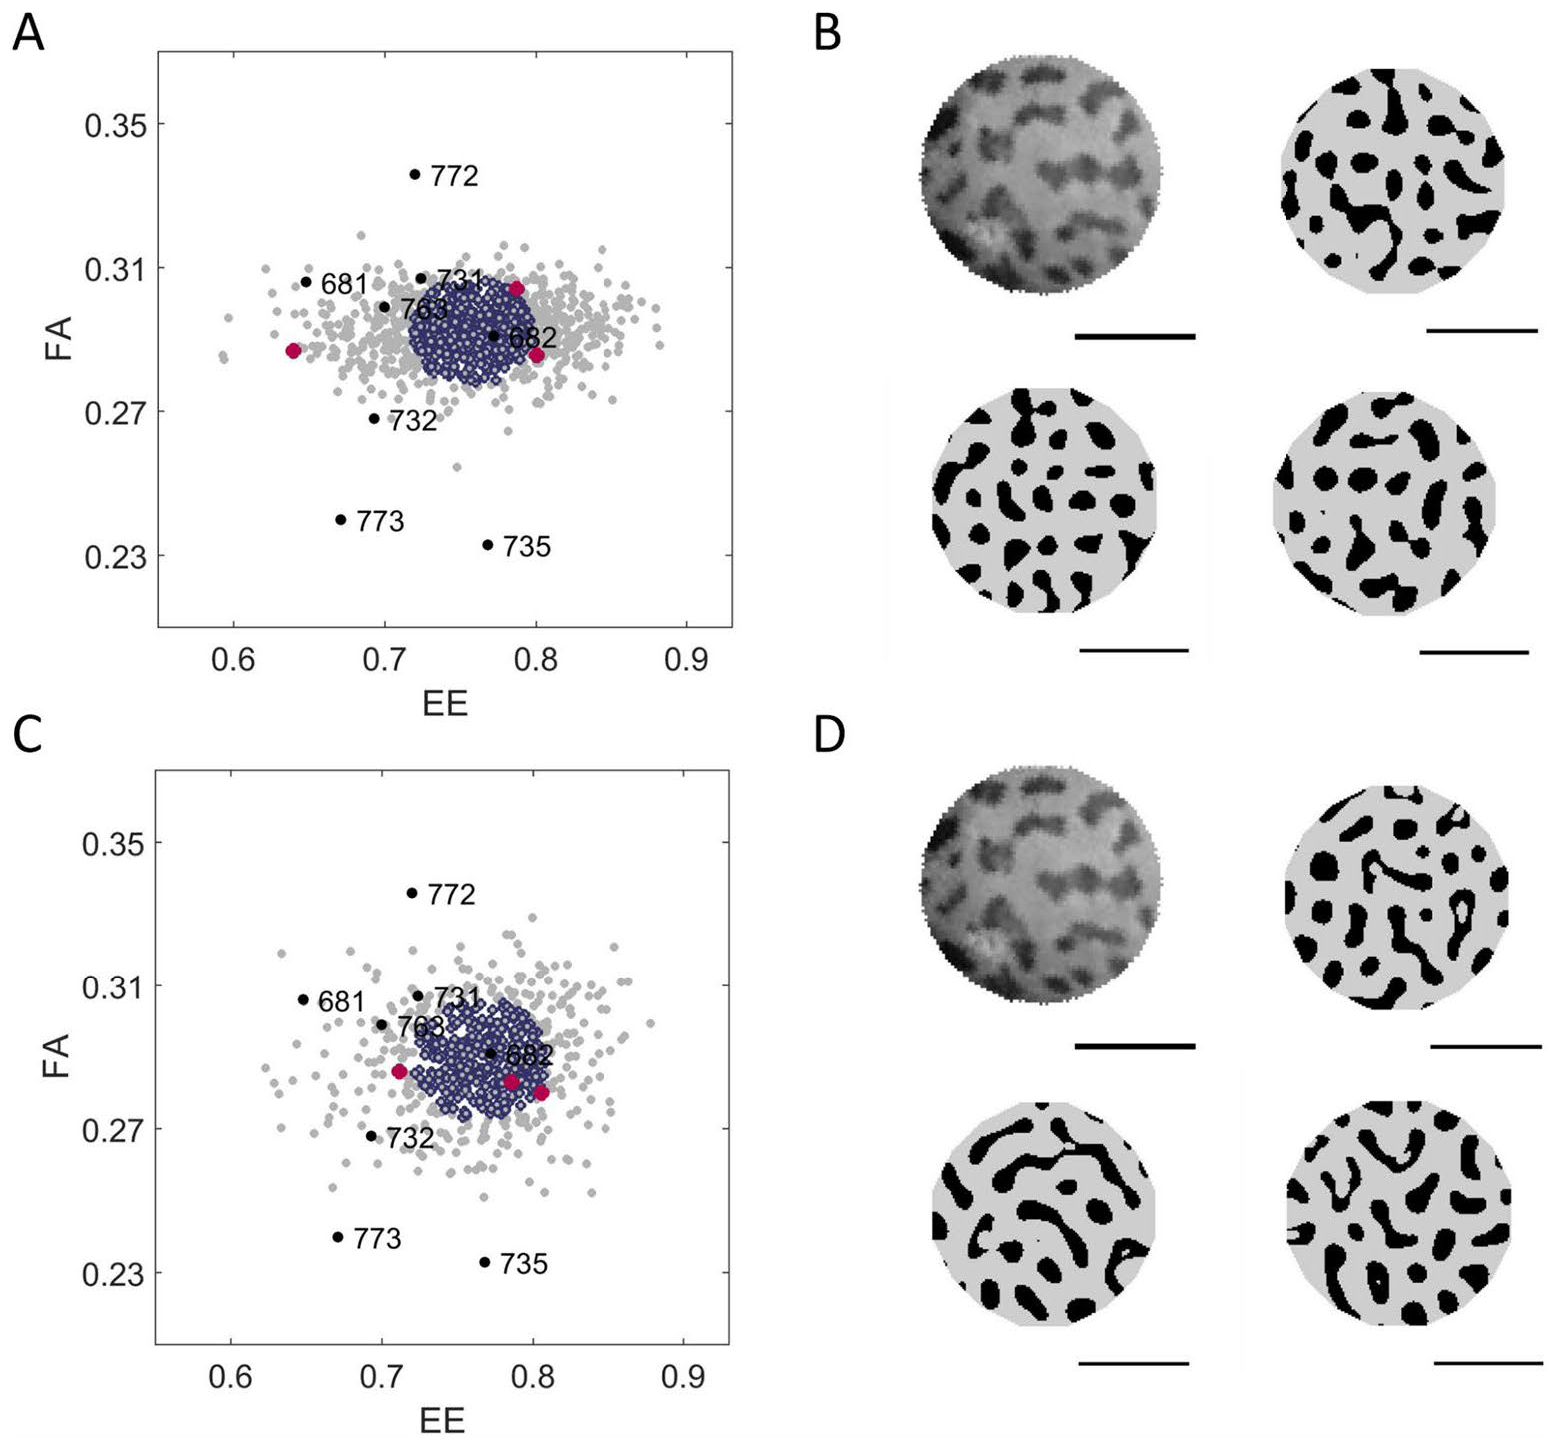
Figure 4: (A) Linear or (C) FitzHugh-Nagumo models. Each dot represents a simulation in Fractional Area (FA)-Eccentricity (EE) space. The location of the original skin pattern is labeled with a white spot; simulations within the 50th percentile for closeness to the skin patterns are dark blue, and the rest are gray. For illustrative purposes, three synthetic patterns are marked by red spots. (B, D) shows the pattern isolated from the image of Gecko #682 and the corresponding patterns of the three "clones" marked by red dots in (A, C). Horizontal bars indicate 0.5 cm. Image reproduced from [1] and covered by a CC-BY 4.0 license (https://creativecommons.org/licenses/by/4.0/).
References:
[1] Kiskowski, M., Glimm, T., Moreno, N., Gamble, T., & Chiari, Y. (2019). Isolating and quantifying the role of developmental noise in generating phenotypic variation. PLOS Computational Biology, 15(4), e1006943.
[2] Glimm, T., Kiskowski, M., Moreno, N., & Chiari, Y. (2021). Capturing and analyzing pattern diversity: an example using the melanistic spotted patterns of leopard geckos. PeerJ, 9, e11829.
[3] ChiariLab YouTube Channel. (May 27, 2020). Randomness in the color pattern of the leopard gecko. https://www.youtube.com/watch?v=pM7YGBrAutQ.
| Author Institutional Affiliation | University of South Alabama, George Mason University, and Western Washington University |
| Author Email | Maria Audi Kiskowski Byrne
Department of Math and Statistics
University of South Alabama
[email protected]
Ylenia Chiari
Department of Biology
George Mason University
[email protected]
Tilmann Glimm
Department of Mathematics
Western Washington University
[email protected]
|