The replicator-mutator equations from evolutionary dynamics serve as a model for
the evolution of language, behavioral dynamics in social networks, and decision-making dynamics
in networked multi-agent systems. Analysis of the stable equilibria of these dynamics has been
a focus in the literature, where symmetry in fitness functions is typically assumed. We explore
asymmetry in fitness and show that the replicator-mutator equations exhibit Hopf bifurcations and
limit cycles for increasing mutation strength \(\mu\). The first animation shows phase portraits of the dynamics as a function of \(\mu\), illustrating a Hopf bifurcation for a particular choice of fitness matrix. The second animation shows bifurcation plots of the dynamics for a class of circulant fitness matrices.
We prove conditions for the existence of stable limit cycles arising from multiple distinct
Hopf bifurcations of the dynamics in the case of circulant fitness matrices. In the noncirculant case, stable limit cycles of the dynamics are coupled to embedded directed cycles in the payoff graph as shown in the third plot in this submission. These cycles correspond to oscillations of grammar dominance in language evolution and to oscillations in behavioral preferences in social networks; for decision-making systems, these limit cycles correspond to sustained oscillations in decisions across the group.
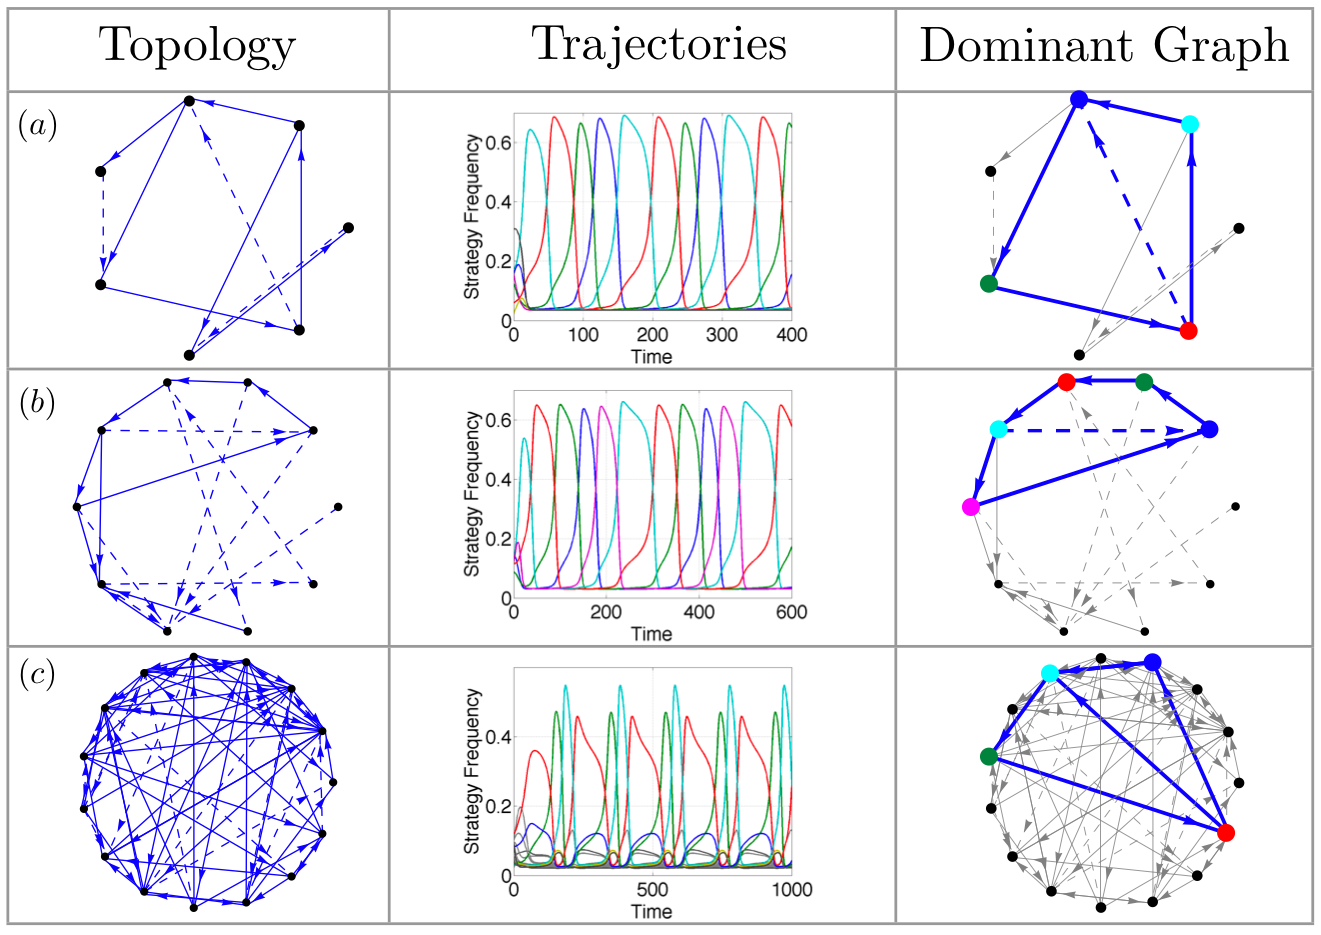
The left panel shows the payoff graph with two types of edges: strong edges (solid lines) with a weight of $b$ and weak edges
(dashed lines) with a weight of \(\epsilon \017b\); here \(b = 0.7\) and \(\epsilon=0.1\). The center panel shows the resulting
trajectories with mutation (Q2) and suitable \(\mu\)\026 (0.2 in (a), 0.25 in (b) and 0.27 in (c)). The right panel highlights the interconnection between nodes corresponding to the dominant components of the
limit cycle trajectories. The color of each of the nodes on the payoff graph matches the color of the corresponding trajectory in the center panel. In each case, it is observed that there is a directed
cycle between the dominant component nodes.
| Author Institutional Affiliation | Princeton University |
| Author Email | |
| Author Postal Mail | D-234 Engineering Quadrangle, Princeton University, Princeton, NJ 08544 |
| Notes | For further details, please refer to:
Pais D, Caicedo-Nunez CH, Leonard NE. Hopf Bifurcations and Limit Cycles in Evolutionary Network Dynamics. SIAM J. Appl. Dyn. Sys. 11(4), 1754-1884, 2012. |