Handling editor: Hinke Osinga
Taking Delay Equation Dynamics to the Cutting Edge
Brian P. Mann, Duke University
Predictive models of manufacturing processes can be
applied to help businesses gain a competitive edge. In this time of
expanding global markets, it has become essential for manufacturers to
improve process efficiencies, maintain stricter part tolerances, and
enhance part quality. Furthermore, the motivation for using
analytical tools for process optimization, rather than costly trial
and error, has perhaps never been greater. One of the most widespread
manufacturing operations is machining where the general goal is to
sculpt a shaped part by removing material from the bulk [8]. The
importance of machining to the aerospace industry has led to the
partnering of Dr. Brian Mann at Duke University with Boeing
researchers Ryan Hanks, Amy Helvey, and Dr. Keith Young who are
investigating the dynamics of a machining process called milling.
 |
|
 |
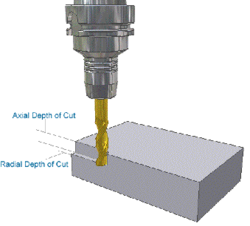
| Figure 1: |
Illustration of the milling process
along with labels on some of the important parameters that can
influence the dynamic stability of the process. The diagram on the
right shows a prototypical stability chart that separates regions in
the parameter space of chatter (labeled Unstable Zone) and
chatter-free cutting (labeled Stable
Zone).
|
|
A primary factor that limits the productivity of
high-speed milling operations is the onset of self-excited vibrations
known as chatter. Chatter can arise due to coupling between the
cutting forces and the tool motions. In an attempt to avoid damage to
the cutting tool, the machining center, or the workpiece, it is
desirable to apply predictive methods to search for regions of
chatter-free cutting. While numerical simulation is an approach that
can be applied relatively easily, it becomes prohibitively time
consuming to explore relatively large regions of parameter space
without an analytical approach.
Aside from avoiding regions of chatter vibration,
maintaining strict part tolerances is also a central concern in the
aerospace industry. Thus parameter combinations that may not result
in chatter vibrations, can still be problematic if the motion
amplitude is relatively large.
In past work these relatively large oscillations
have been called surface location error to describe the contribution
of the surface placement error that arises from dynamic tool
deflections. Theoretical investigations of these dynamic phenomena
are complicated by the fact that the governing equations contain time
delay(s), periodic coefficients, and motion dependent
discontinuities.
 |
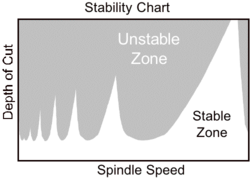
| Figure 2: |
Schematic diagram of a milling operation showing
the relative phasing of vibrations that can result in chip thicknesses
(the shaded region) of chatter and chatter-free
processes. Pictures show both the case of chatter (bottom right) and chatter-free machining (bottom
left).
|
The focus of many recent works has been the
occurrence of new bifurcation phenomena that can occur during milling
operations for small radial depths of cut; see
Figure 1. In addition to Neimark-Sacker or
secondary Hopf bifurcations, period-doubling behavior has now been
analytically and/or experimentally confirmed by several researchers
[2-6].
An even more recent discovery is the phenomenon known as an isolated
island of chatter vibration. To be more specific, an isolated island
is a parameter domain in the stability chart that separates or appears
to break away from the other regions of chatter vibration. These
regions are entirely surrounded by completely stable or chatter-free
parameter regions; see Figure 3. Recent
works on this topic have attributed this phenomenon to certain common
tool geometries (i.e. the tool helix angle).
In the figures that follow, illustrative examples
are provided for the types of dynamic behavior that has been uncovered
in the combined experimental and theoretical investigations. Figure 3 shows an example stability chart with
markers that represent the locations in the parameter space where
experiments were performed. The results of Figure 4 show four experimental time series
along with the corresponding Poincaré section. Since only
displacements were recorded in the experimental tests, visualization
of the qualitative features of each attractor required the application
of delayed embedding techniques to reconstruct a topologically
equivalent phase space in the coordinates displacement vs. delayed
displacement. Following the methods suggested in [1], algorithms were developed to graph the mutual
information function for the time series and the shifted time series.
The first minimum of the mutual information graph was used as the time
shift, or delay, between the original time series and the shifted time
series. Using the false nearest neighbors approach of [1], the embedding dimension was found to be
equivalent to 2 for each of the presented time series.
Poincaré sections were created by periodically sampling the
displacement and delayed displacement signals as shown in the
right-hand graphs of Figure 4.
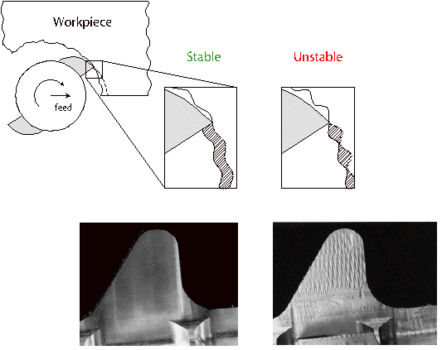
![Example region of the stability chart where experimental tests were performed to study the isolated island phenomenon in reference [7]. The letters from this graph match the experimental time series and Poincare Sections shown in the plots of Fig. 4](/Portals/DSWeb/EasyGalleryImages/2/1639/ma_ar_000001435.png) |
| Figure 3: |
Example region of the stability chart where
experimental tests were performed to study the isolated island
phenomenon in reference [7]. The letters from this graph match the
experimental time series and Poincaré Sections shown in the
plots of Figure 4.
|
The first test (labeled case A) is clearly a stable
case since both the once-per-period and Poincaré section data
show that the system approaches a single fixed-point value.
Quasi-periodic motions are observed in the second case of Figure 4 as the tool motions are incommensurate
with the period. The remaining two cases, labeled C and D, provide
experimental evidence of isolated islands of chatter vibration. These
results confirm that theoretical results that predict period-doubling
behavior will occur.
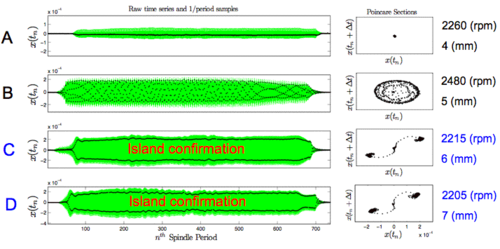 |
| Figure 4: |
Experimental times series and Poincaré
sections used to illustrate the types of behavior that have been
uncovered during the collaborative research. Green areas are the
continuously sampled data, and black dots are the 1/period sampled
displacement data (left column graphs). The Poincaré sections
(right column graphs) are displayed in
displacement vs. delayed displacement
coordinates.
|
References
| [1] |
|
H. D. I. Abarbanel, Analysis of Observed Chaotic Data, Springer, New York, 1996.
|
| [2] |
M. A. Davies, J. R. Pratt, B. Dutterer, and T. J. Burns, "Stability
prediction for low radial immersion milling," Journal of Manufacturing Science and Engineering 124, no. 2 (2002): 217–225.
|
| [3] |
T. Insperger, B.P. Mann, G. Stépán, and P.V. Bayly, "Stability of up-milling and down-milling,
Part 1: Alternative analytical methods," International Journal of Machine Tools and Manufacture, 43 (2003): 25–34.
|
| [4] |
B.P. Mann, N.K. Garg, K.A. Young, and A.M. Helvey, "Milling bifurcations from structural asym-
metry and nonlinear regeneration," Nonlinear Dynamics, 42, no. 4 (2005): 319–337.
|
| [5] |
B.P. Mann, T. Insperger, P.V. Bayly, and G. Stépán, "Stability of up-milling and down-milling,
Part 2: Experimental Verification," International Journal of Machine Tools and Manufacture, 43 (2003): 35–40.
|
| [6] |
B.P. Mann and K.A. Young, "An empirical approach for delayed oscillator stability and parametric
identification," Proceedings of the Royal Society A, 462 (2006): 2145–2160.
|
| [7] |
B. Patel, B.P. Mann, K.A. Young, "Uncharted islands of chatter instability in milling,"
International Journal of Machine Tools and Manufacture 48, no. 1 (2008): 124-134.
|
| [8] |
J. Tlusty, Manufacturing Processes and Equipment,
Prentice Hall, Upper Saddle River, NJ, 1 ed., 2000.
|